Cheshunt Property & Estate Agent Area Guide
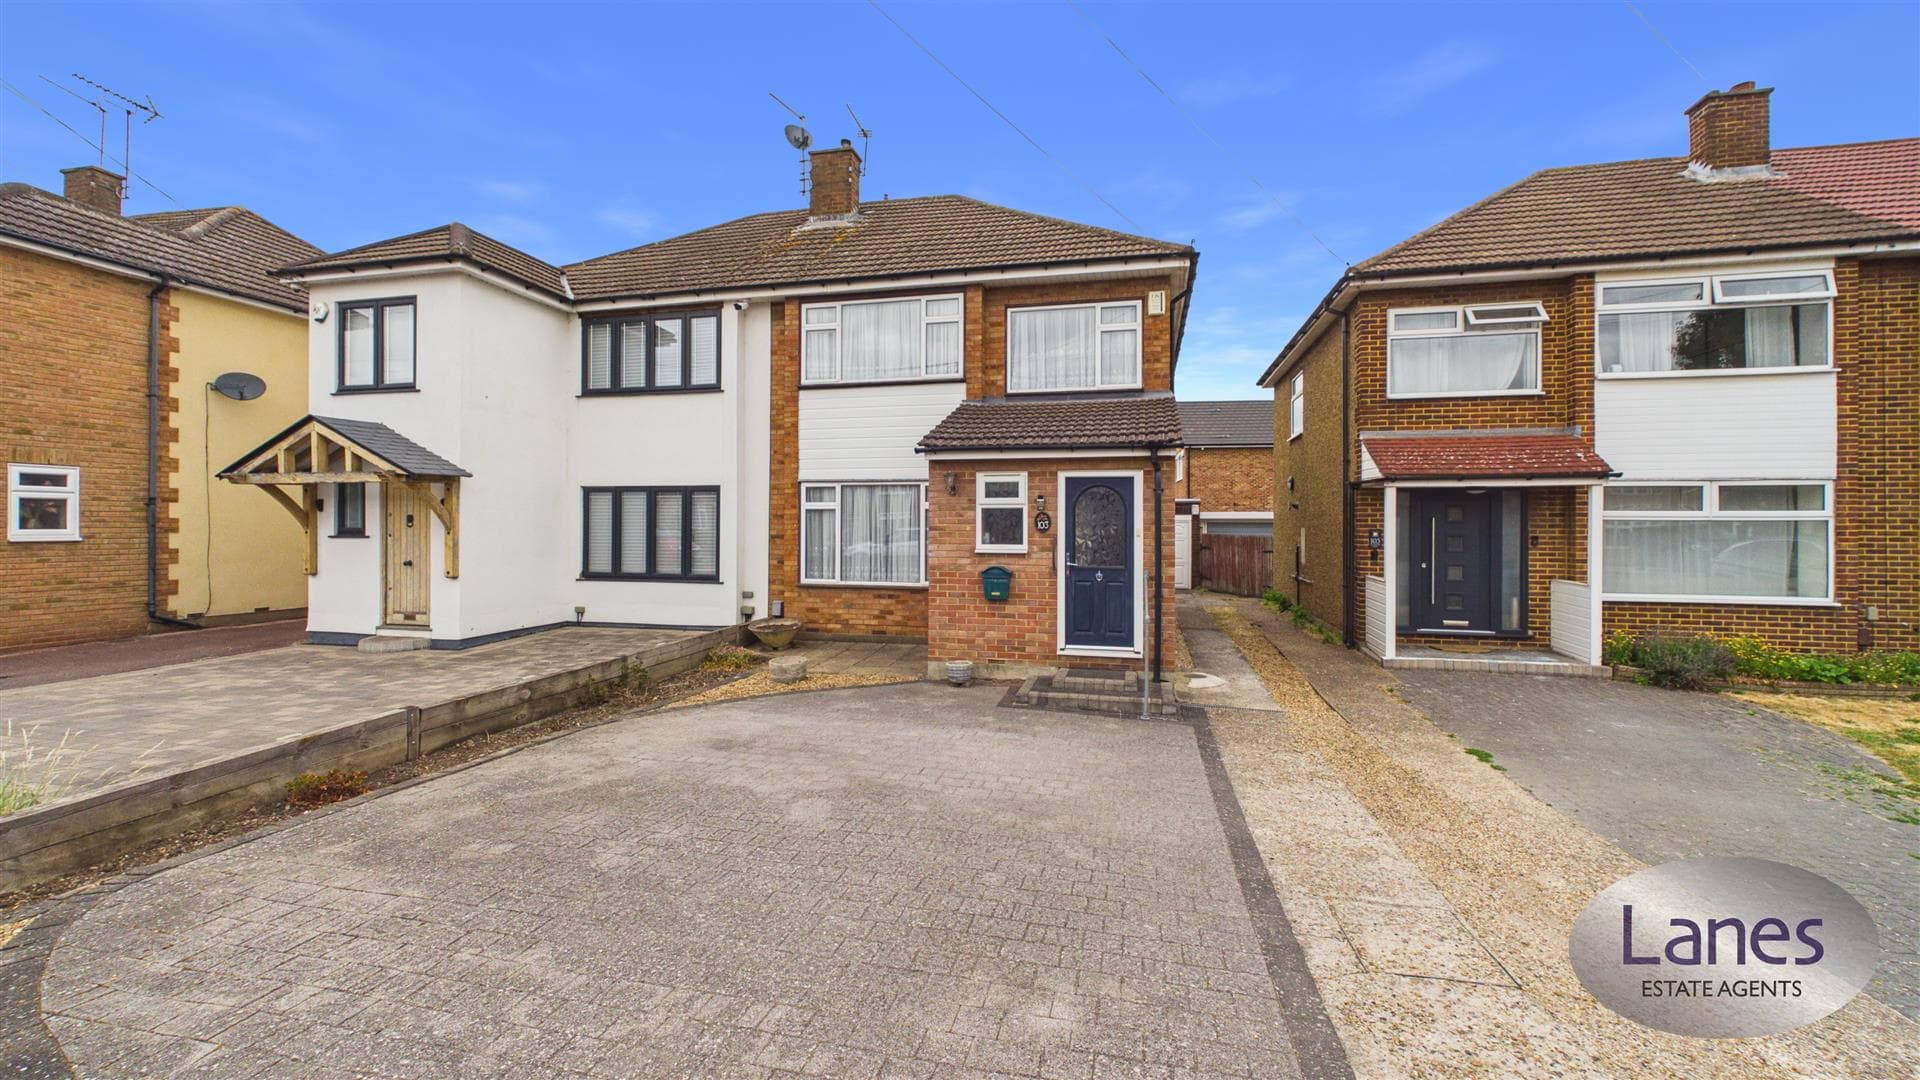
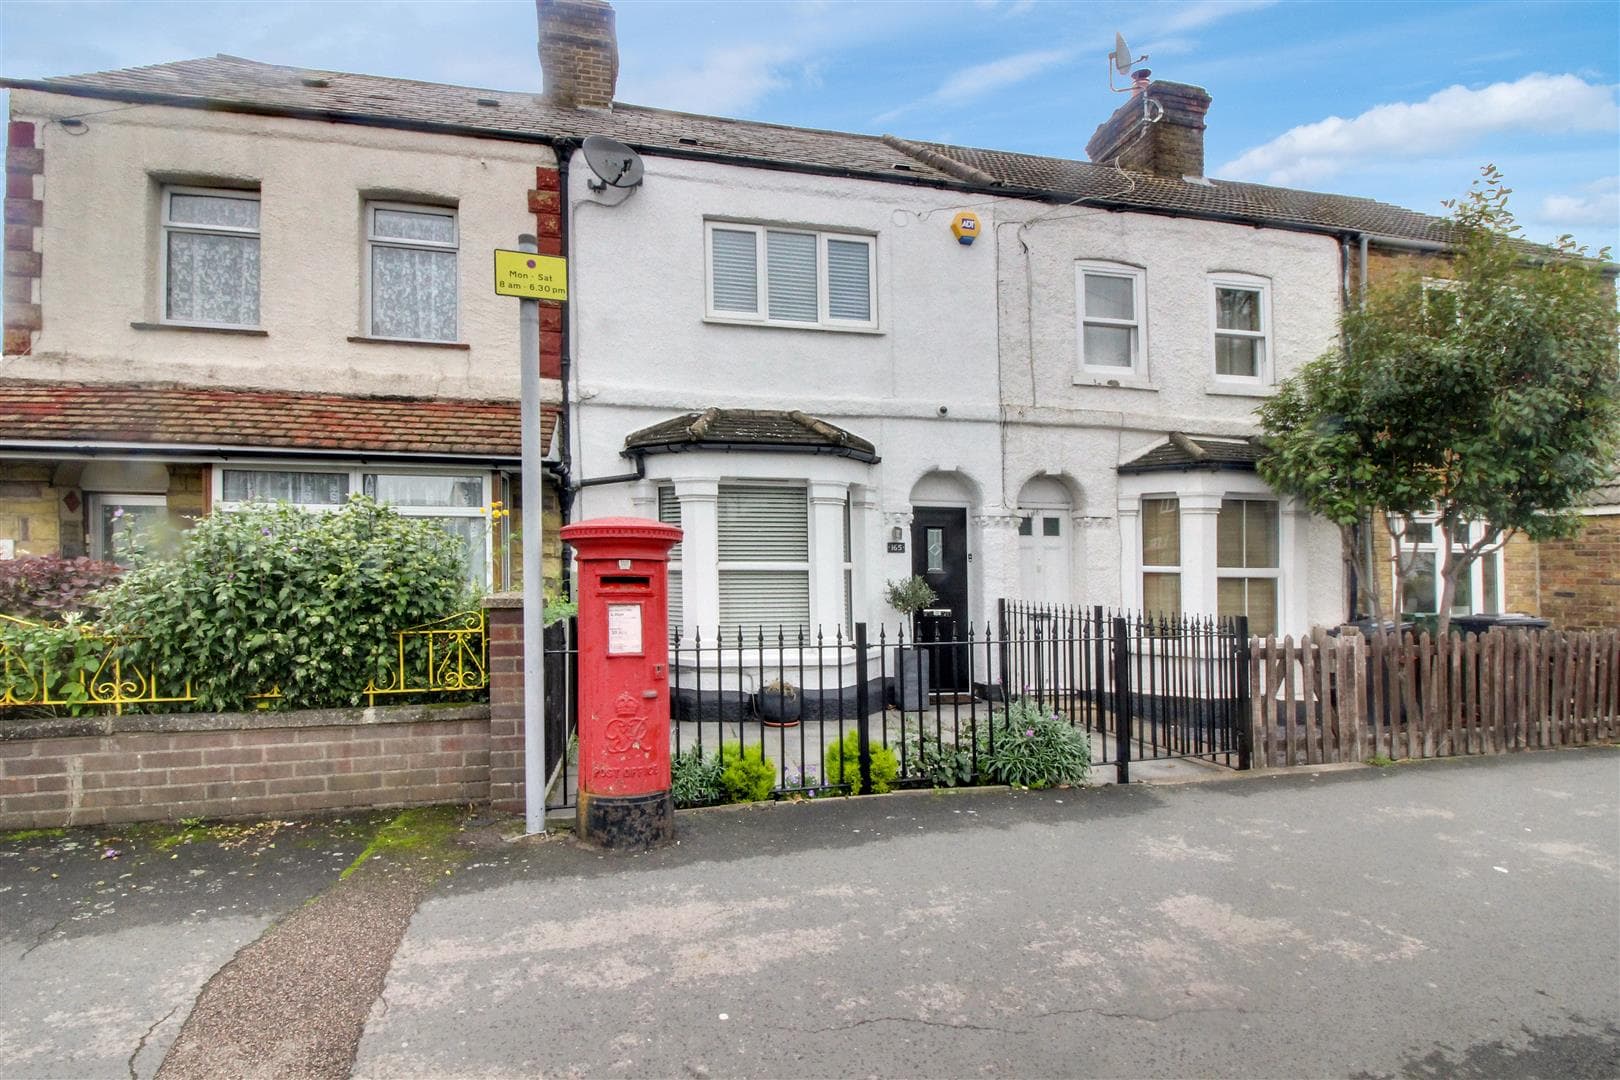
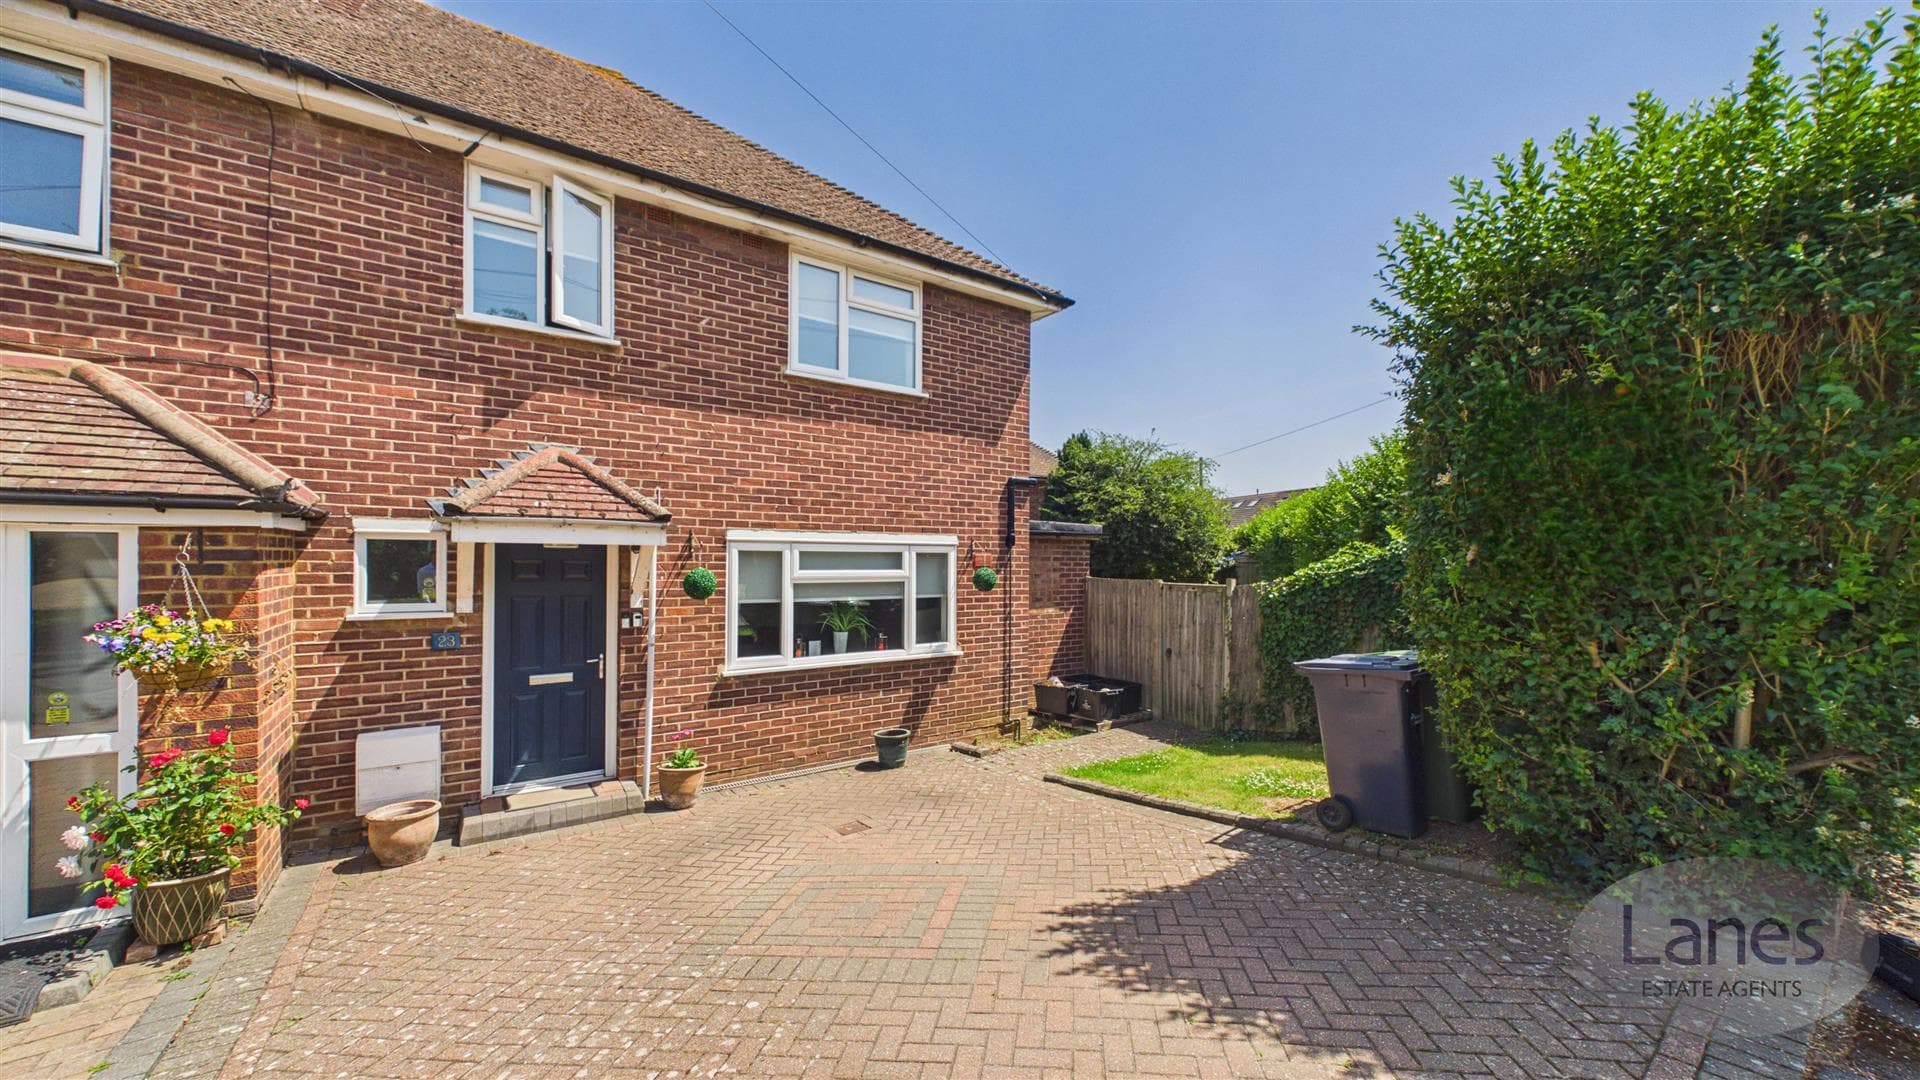
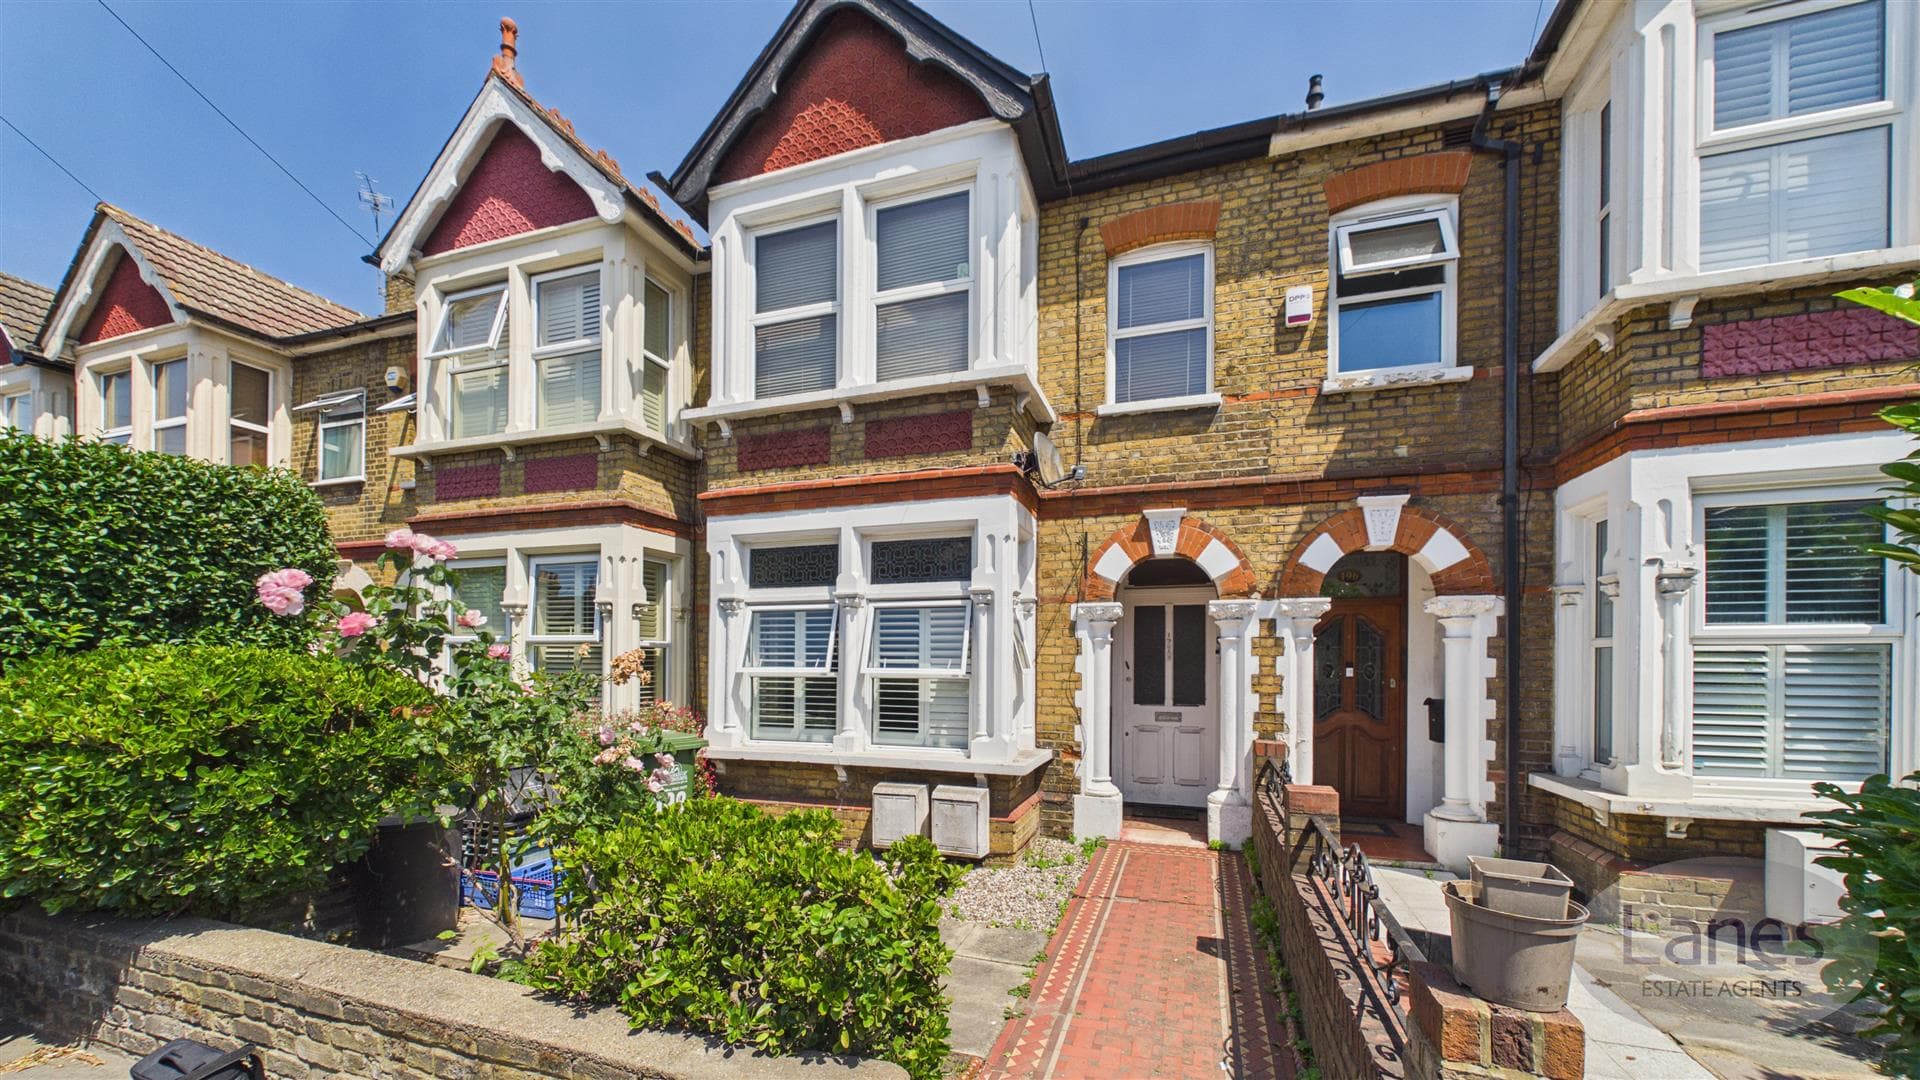
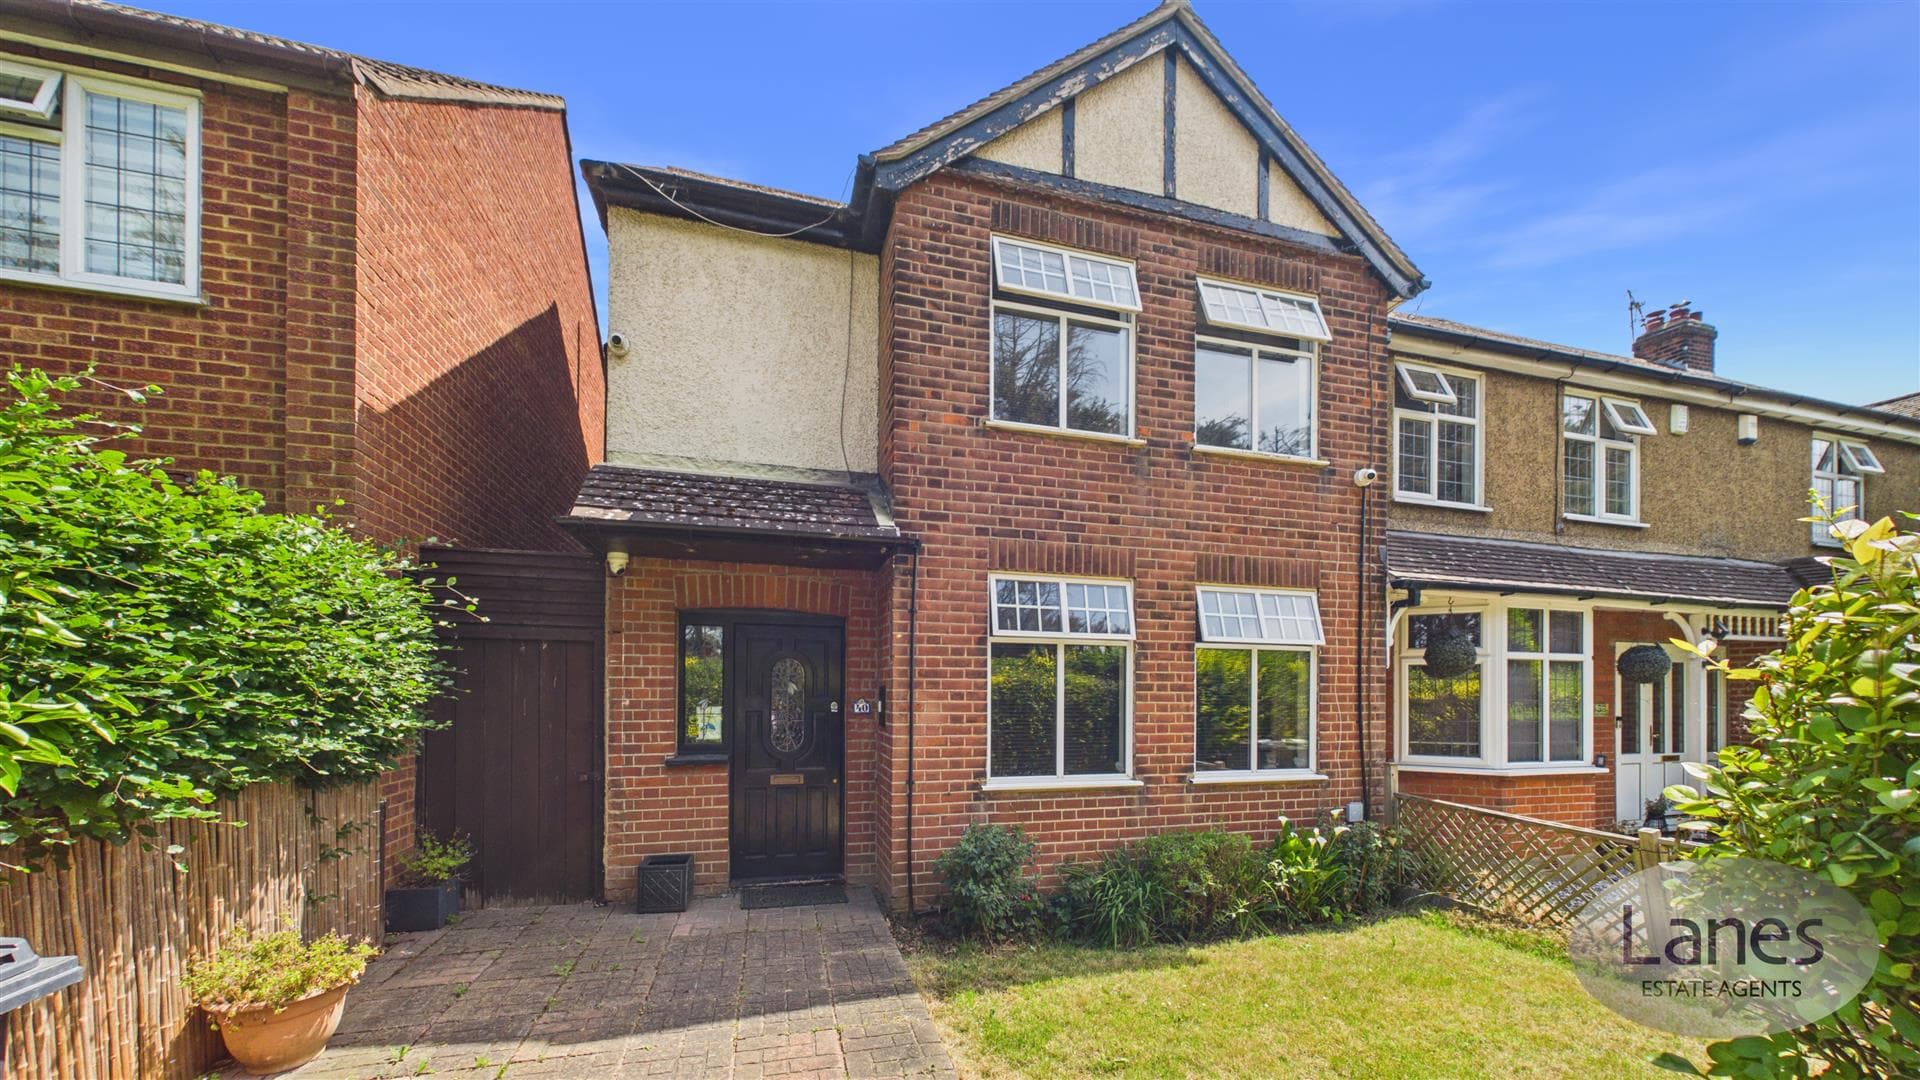
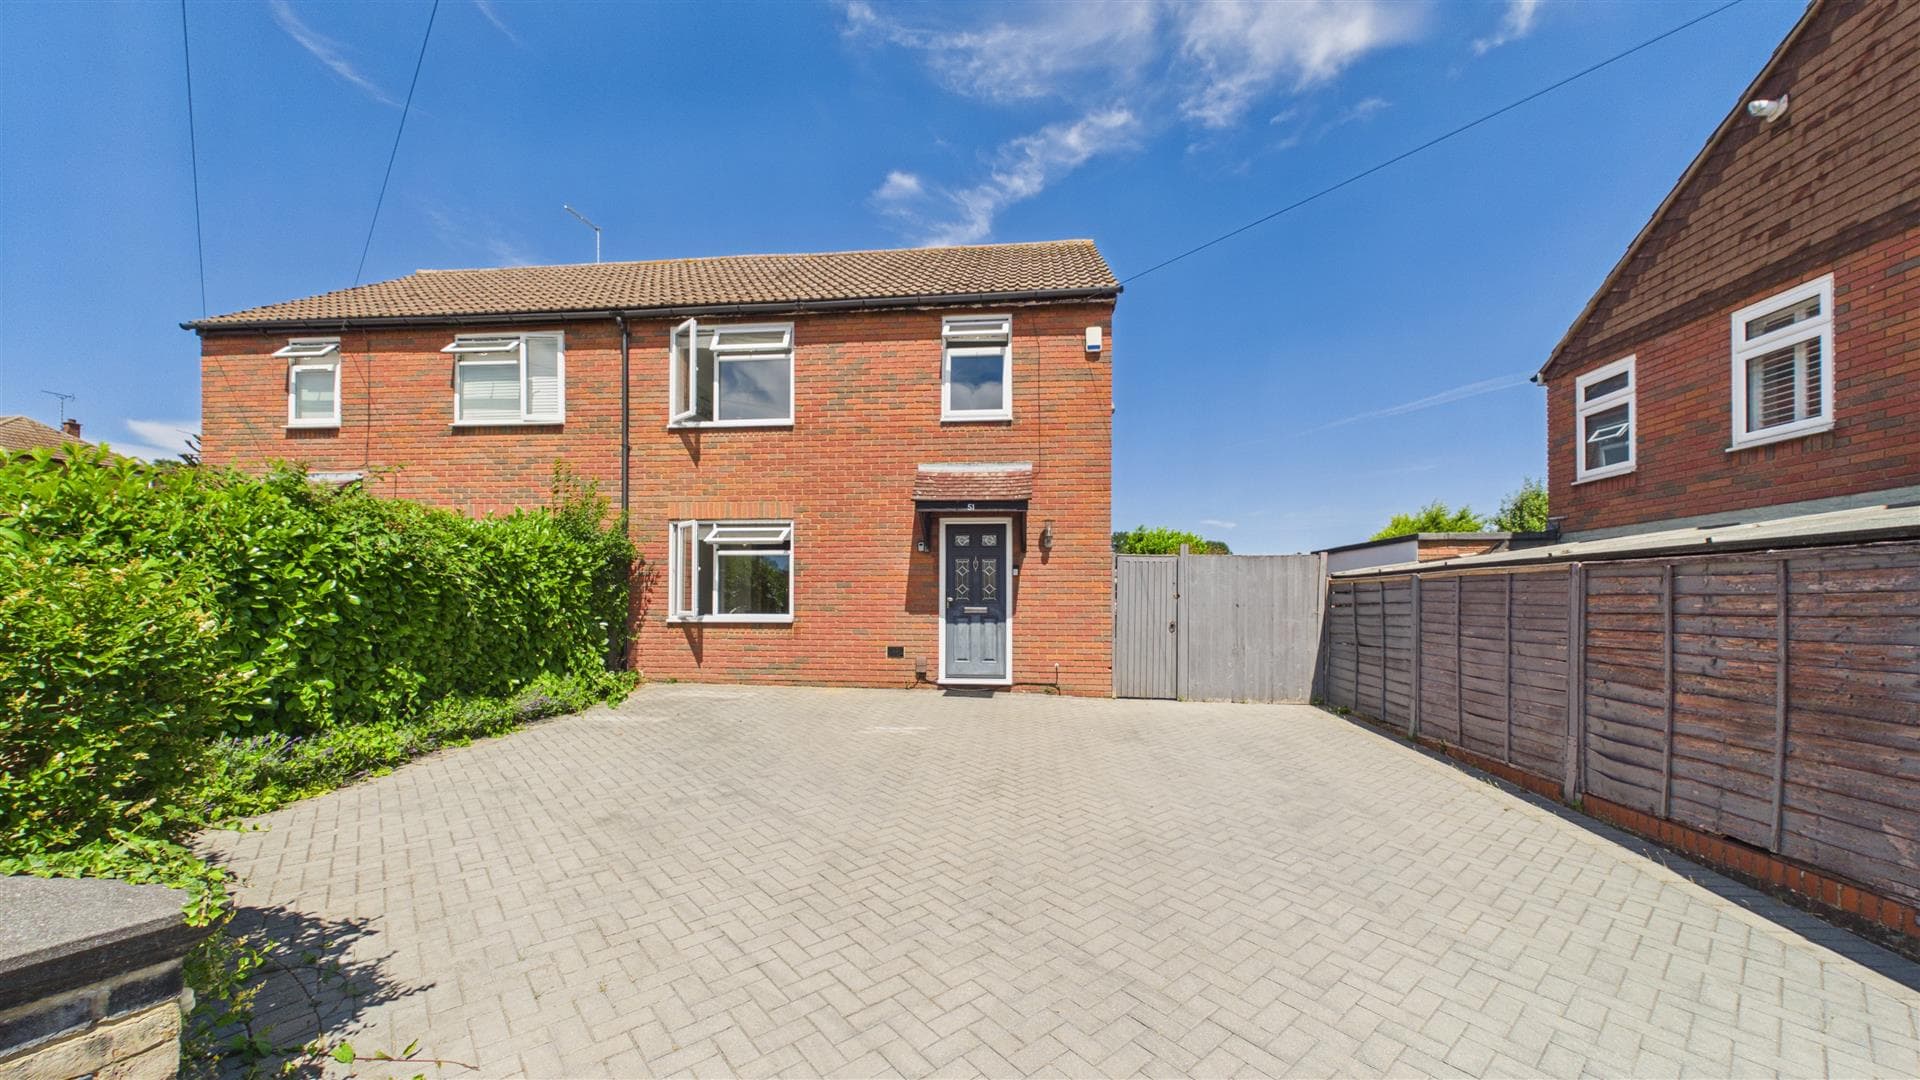
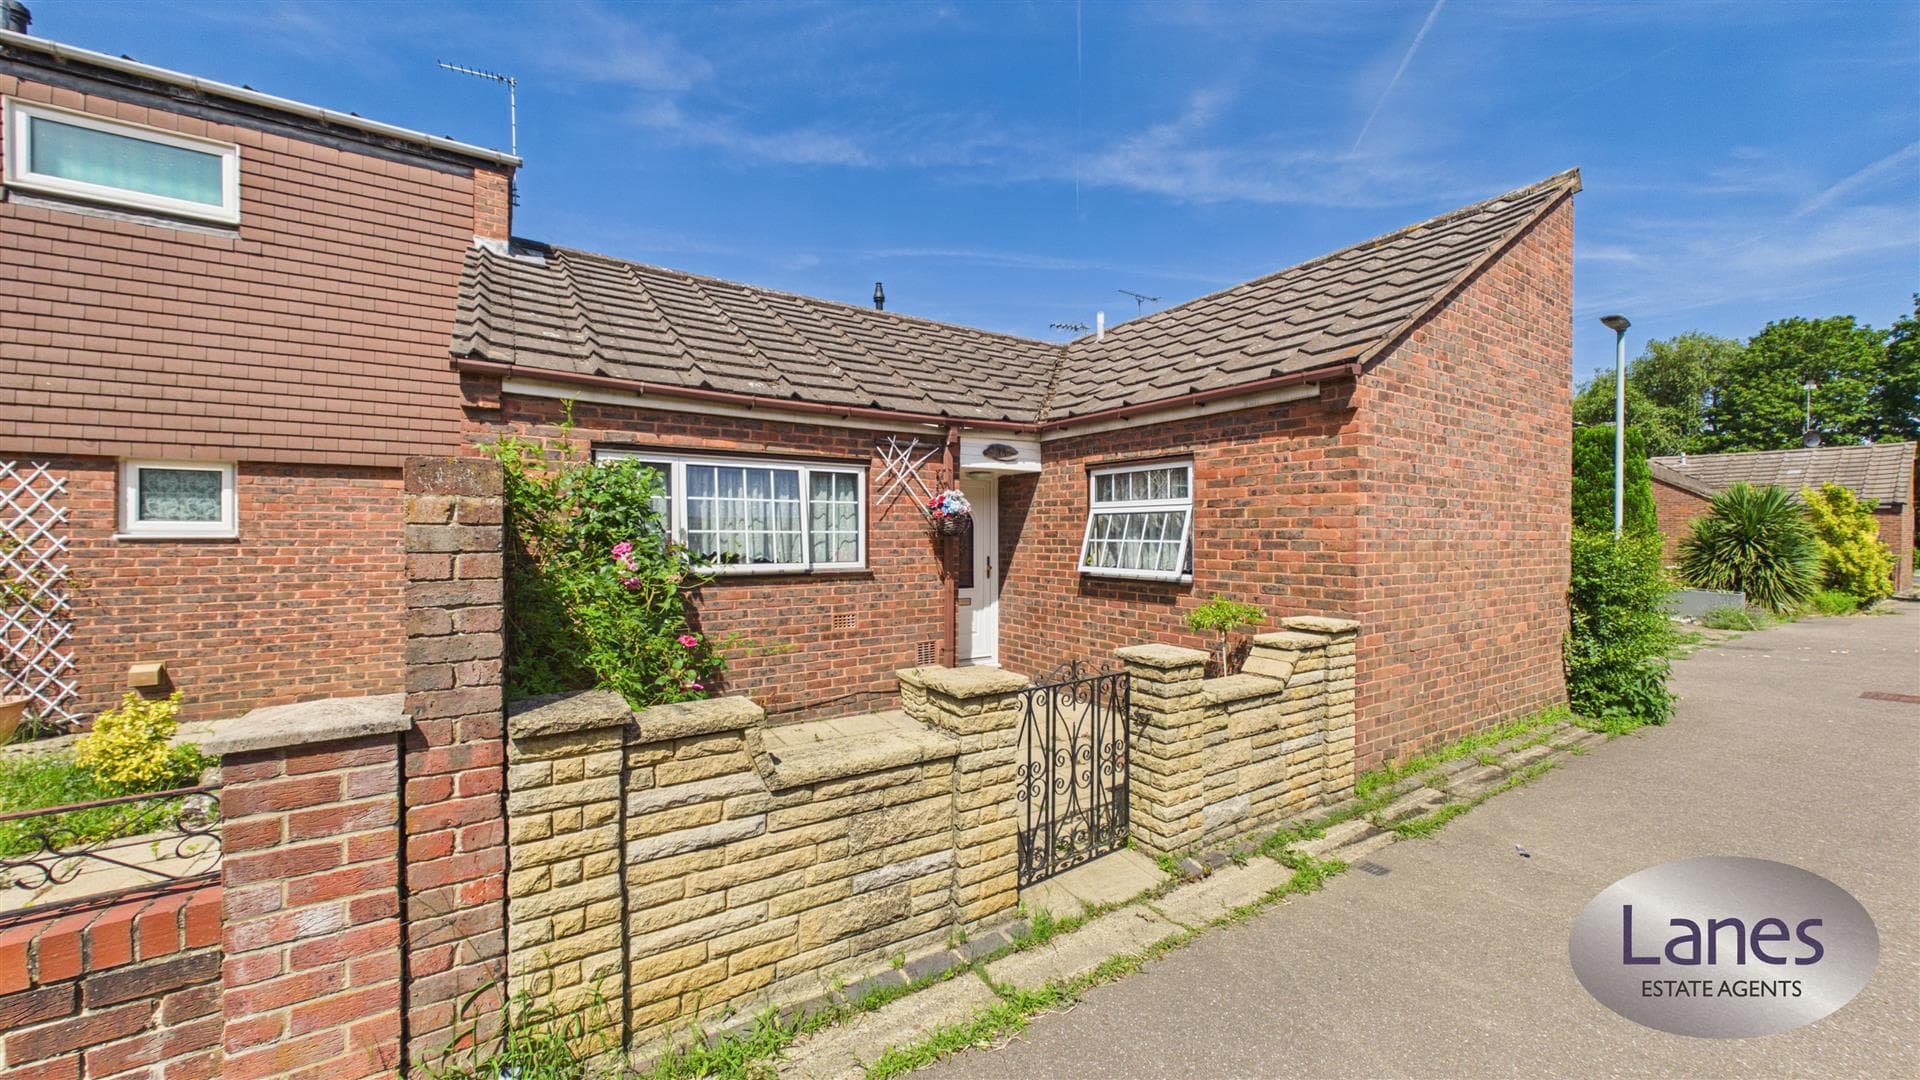
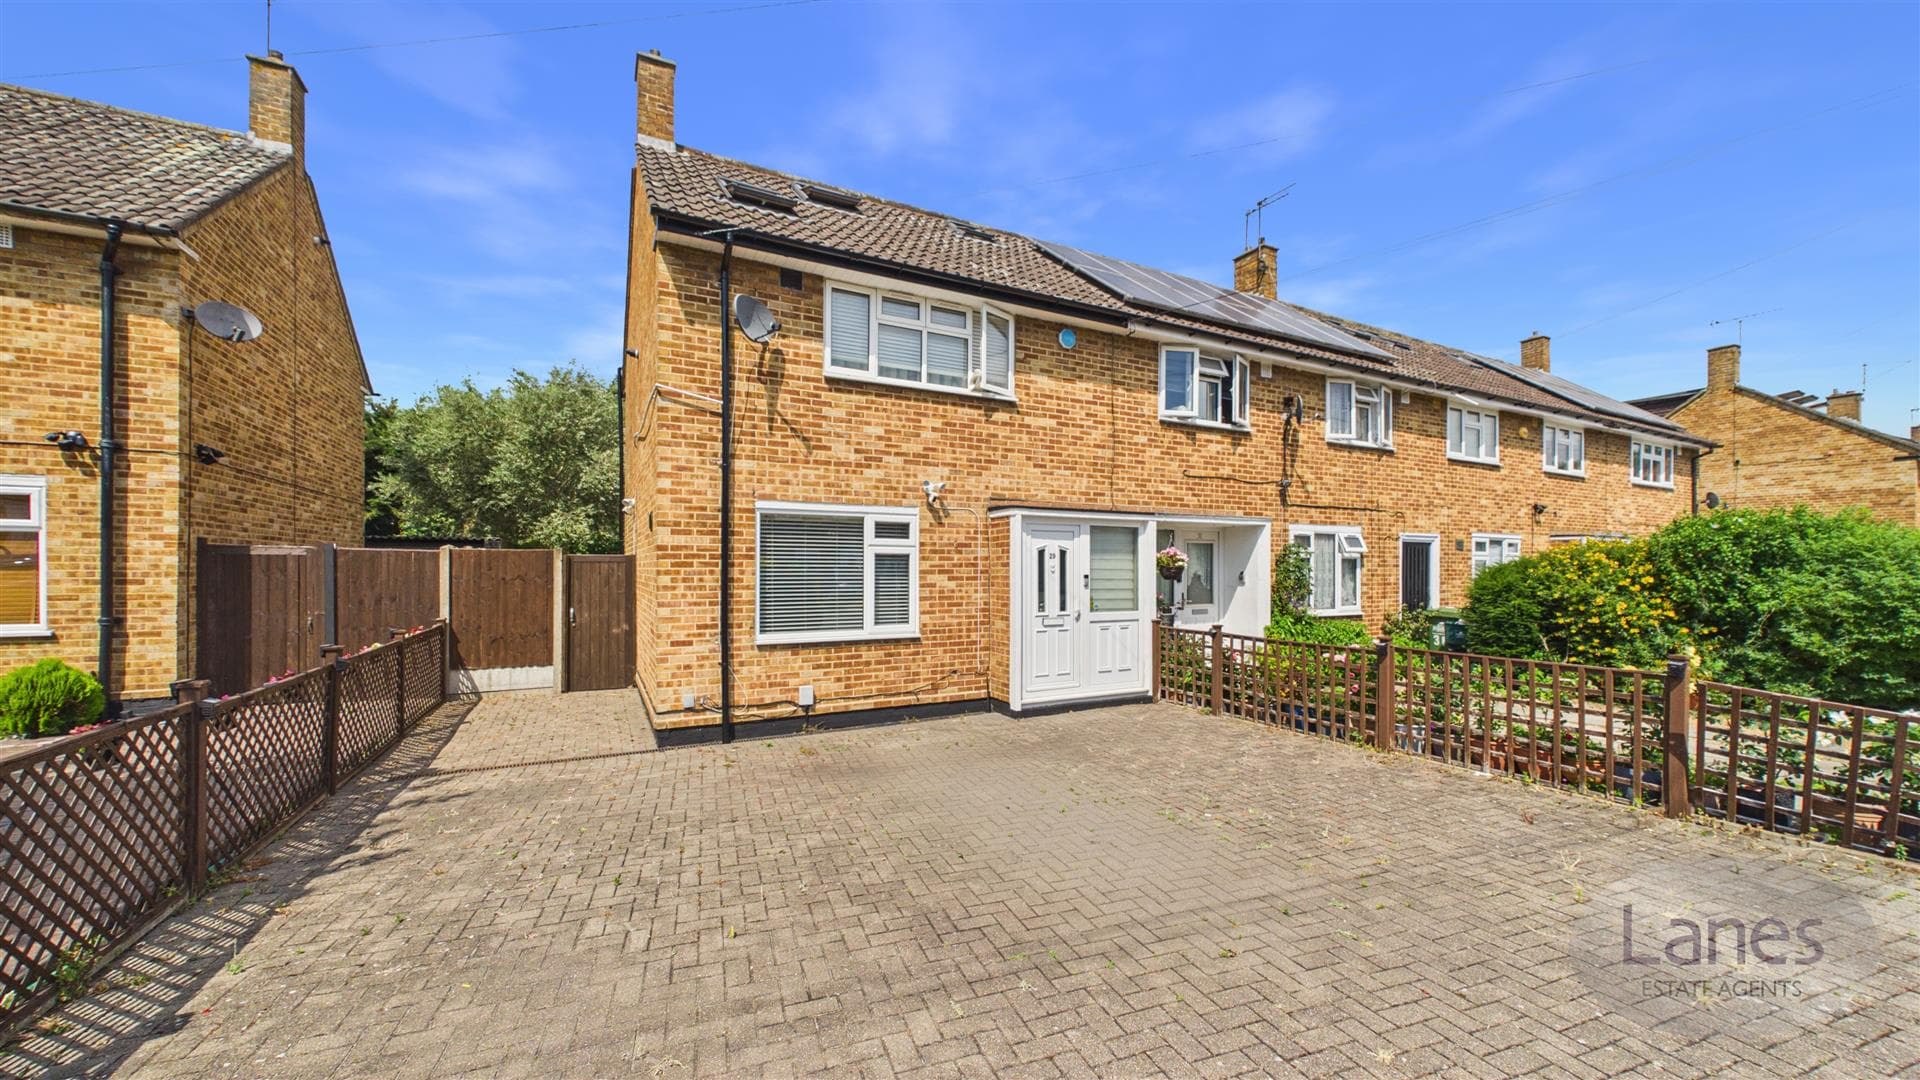
Our Cheshunt Property & Estate Agent area guide is full of up-to-date market information, plus a live map of local amenities and a selection of new-to-market properties.
Live market data in Cheshunt
Property Prices
Average Property Price
£397,834
£463 per Square Foot
Price change
-5.0%
In the last 12 months
Price change
+5.9%
In the last 5 years
611 Properties Sold
In the last 12 months
Property prices by type
Detached
Average price
£655,035
Price changeLast 12 months
-9.0%
% of Market
11.0%
Semi Detached
Average price
£467,910
Price changeLast 12 months
-5.2%
% of Market
23.1%
Terraced
Average price
£407,943
Price changeLast 12 months
-1.9%
% of Market
43.2%
Flats
Average price
£222,296
Price changeLast 12 months
-8.8%
% of Market
22.7%
Rental market average price
Rental values
have changed by
have changed by
-5.0%
In the last 12 months
How much do houses let for?
£2,106
Per calendar month
How much do flats let for?
£1,474
Per calendar month
What is the average
annual rental yield?
4.84%
